
Ein neues Tool von Google soll testen und Ihnen Empfehlungen zur Verbesserung von Leistung, SEO, Sicherheit, Best Practices und Zugänglichkeit geben.
Google ist kürzlich gestartet Leuchtturmein Open-Source-Tool zum manuellen und automatischen Auditieren Ihrer Website.
Inhaltsverzeichnis
Welche Metriken werden von Google Lighthouse getestet?
Es gibt mehr als 75 Metriken, die es testet und Ihnen eine Gesamtpunktzahl gibt. Als Websitebesitzer, SEO-Analyst und Webmaster könnten Sie an einigen der folgenden beliebten interessiert sein.
- Leistung – Zeit bis zur Interaktion, Latenz, Geschwindigkeitsindex, Ressourcenoptimierung, TTFB, Bereitstellung von Assets, Ausführungszeit von Skripten, DOM-Größe usw.
- SEO – Mobilfreundlich, Meta, Crawling, Kanonisch, Struktur usw.
- Best Practices – Bildoptimierung, JS-Bibliotheken, Browser-Fehlerprotokollierung, Zugriff über HTTPS, bekannte JS-Schwachstellen usw
- Zugänglichkeit – Seitenelemente, Sprache, ARIA-Attribute usw.
- PWA (Progressive Web Application) – Umleitung von HTTP zu HTTPS, Antwortcode ok, schnelles Laden auf 3G, Begrüßungsbildschirm, Ansichtsfenster usw.
Es ist ein fantastisches Werkzeug, und Sie können es auf vielfältige Weise verwenden.
Das ist richtig – so viele Möglichkeiten. Wenn Sie ein Entwickler sind, können Sie Node.js verwenden, um einen Test programmgesteuert auszuführen. Es gibt bereits einige Tools auf dem Markt, die von Lighthouse unterstützt werden und eine kontinuierliche Überwachung der Websiteleistung bieten.
Lassen Sie uns herausfinden, wie Sie den Lighthouse-Test für Ihre Website durchführen.
Beginnen Sie mit dem einfachsten.
Messung durch web.dev
Google veröffentlichte web.dev vor einigen Monaten und gewann an Popularität. Online testen ist einfach.
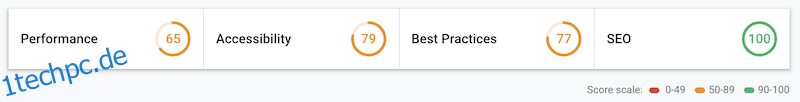
Gehe zu Messen Seite und geben Sie die URL ein, um die Prüfung auszuführen. Es dauert ein paar Sekunden, und Sie sollten den detaillierten Bericht mit der Gesamtpunktzahl sehen.
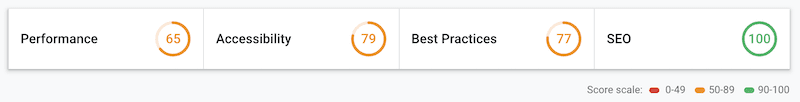
Die Ergebnisse zeigen auch den Test der Erfolgsmetriken für die bestandenen Audits und die Arbeit an diesen Bedürfnissen.
Verbringen Sie nicht zu viel Zeit damit, 100 zu erreichen. Selbst die Websites von Google erreichen das nicht.
Betrachten Sie sie als Richtlinien und versuchen Sie, sich so weit wie möglich zu verbessern.
Hinweis: web.dev emuliert einen Test mit einem mobilen Gerät, und während ich schreibe, sehe ich keine Option zum Testen mit Desktop.
Chrom
Wussten Sie, dass Lighthouse in Ihrem Chrome-Browser verfügbar ist? Und die gute Nachricht ist, dass Sie wählen können, ob Sie mit Mobile oder Desktop testen möchten, und es ist in den Entwicklertools verfügbar.
- Öffnen Sie den Chrome-Browser
- Greifen Sie zum Testen auf Ihre Website zu
- Öffnen Sie die Entwicklertools (drücken Sie F12, wenn Sie Windows verwenden) oder klicken Sie mit der rechten Maustaste auf die Seite und klicken Sie auf Inspizieren.
- Wechseln Sie zur Registerkarte Audits.
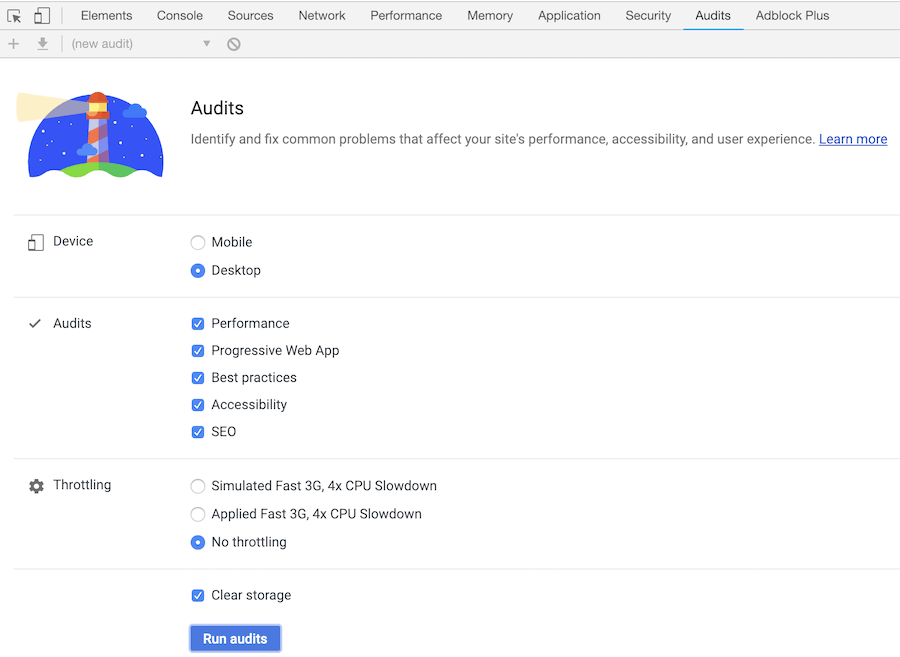
Wie Sie oben sehen können, haben Sie die Möglichkeit, auszuwählen, was Sie testen möchten. Dies ist großartig, um sich auf Ihr Ziel zu konzentrieren und die Prüfungsergebnisse schneller zu erhalten.
Aussehen und Verhalten der Ergebnisse von Chome und web.dev sind fast ähnlich.
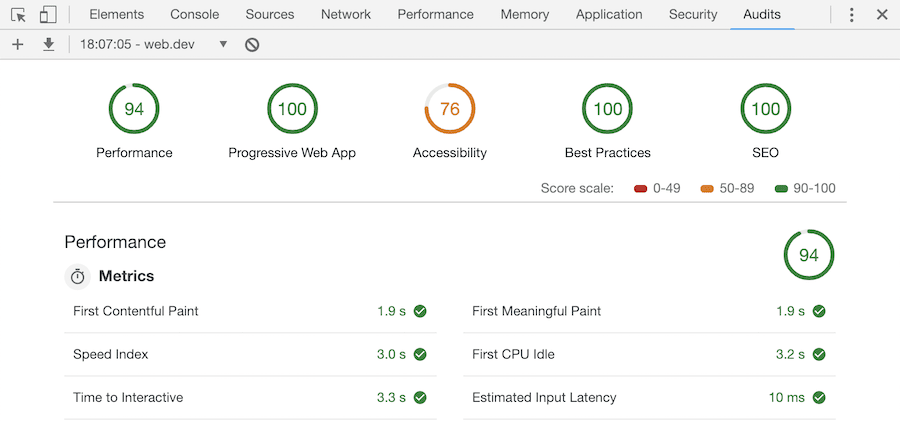
Aber wenn Sie genau hinsehen, gibt es hier eine zusätzliche Metrikgruppe – Progressive Web App. Ein weiterer Grund, mit Chrome zu auditieren.
wdzwdz Leuchtturm-API
Sie können die Webleistungsdaten auch mit der wdzwdz Lighthouse API abrufen. Dadurch werden Lighthouse-Metriken für Mobilgeräte oder Desktops mit nur einem Klick im HTML-, JSON- oder CSV-Format extrahiert.
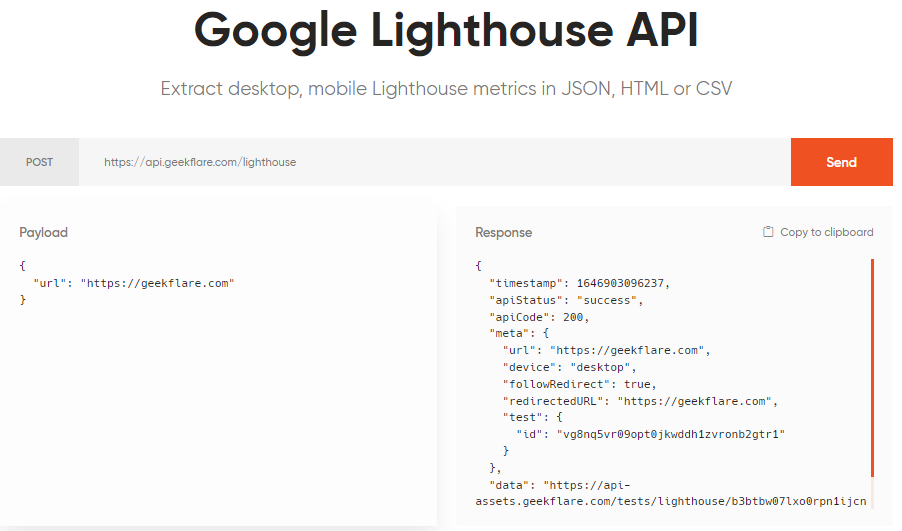
Sie können den Bericht auch anpassen, indem Sie das Ausgabeformat ändern und/oder sich auf eine bestimmte Metrik wie SEO konzentrieren.
{
  "parameters": [
      "--output=html",
      "--only-categories=seo",
  ],
  "url": "example.com"
}
Und zum Glück haben wir eine unverbindliche kostenlose Stufe, die 3000 API-Aufrufe pro Monat beinhaltet. Die kostenpflichtigen Anbieter fügen jedoch Unterstützung für mehrere Standorte, Proxy in Wohngebieten und höhere Anfrageraten hinzu, beginnend bei nur 5 US-Dollar pro Monat.
Node.js
Lighthouse ist als Node-Modul verfügbar. Sie können es auf Ihrem Server installieren und programmgesteuert oder über die Befehlszeile verwenden. Schauen wir uns schnell an, wie Lighthouse installiert wird, um einige Tests durchzuführen.
Lighthouse unter Ubuntu 18.x installieren
Folgendes habe ich auf dem getestet DigitalOcean Server. Lighthouse erfordert Node LTS 8.9 oder höher, und ich gehe davon aus, dass Sie es bereits installiert haben. Wenn nicht, lesen Sie diese Node.js-Installationsanleitung.
Außerdem muss auf dem Server ein Chromium-Browser installiert sein. Ich habe die Installationsanleitung hier behandelt.
Die Installation von Lighthouse ist ebenso unkompliziert wie bei anderen Modulen.
- Melden Sie sich bei Ihrem Server an
- Führen Sie zur Installation den folgenden Befehl aus
npm install -g lighthouse
Ich verwende hier -g, also wird es als globales Modul installiert.
[email protected]:~# npm install -g lighthouse
/usr/bin/lighthouse -> /usr/lib/node_modules/lighthouse/lighthouse-cli/index.js
/usr/bin/chrome-debug -> /usr/lib/node_modules/lighthouse/lighthouse-core/scripts/manual-chrome-launcher.js

> [email protected] postinstall /usr/lib/node_modules/lighthouse/node_modules/axe-core
> node build/utils/postinstall.js

+ [email protected]
added 179 packages from 119 contributors in 10.094s
[email protected]:~#
Führen Sie nach der Installation den Lighthouse-Befehl aus, um sicherzustellen, dass er korrekt installiert wurde.
[email protected]:~# lighthouse
Please provide a url

Specify --help for available options
[email protected]:~#
Gut, der Leuchtturm ist bereit, die Prüfung durchzuführen. Lassen Sie uns einige Testoptionen ausprobieren.
So führen Sie einen Test mit einem Headless-Browser aus
lighthouse URL --chrome-flags="--headless"
Sie müssen eine absolute URL angeben, einschließlich HTTP oder HTTPS.
Ex:
[email protected]:~$ lighthouse https://wdzwdz.com --chrome-flags="--headless"
  ChromeLauncher Waiting for browser. +0ms
  ChromeLauncher Waiting for browser... +1ms
  ChromeLauncher Waiting for browser..... +511ms
  ChromeLauncher Waiting for browser.....✓ +2ms
  status Connecting to browser +176ms
  status Resetting state with <a href="https://wdzwdz.com/aboutblank-in-chrome-firefox-safari/">about:blank</a> +24ms
  status Benchmarking machine +30ms
  status Initializing… +508ms
  status Loading page & waiting for onload Scripts, CSSUsage, Viewport, ViewportDimensions, ThemeColor, Manifest, RuntimeExceptions, ChromeConsoleMessages, ImageUsage, Accessibility, LinkElements, AnchorsWithNoRelNoopener, AppCacheManifest, Doctype, DOMStats, JSLibraries, OptimizedImages, PasswordInputsWithPreventedPaste, ResponseCompression, TagsBlockingFirstPaint, MetaDescription, FontSize, CrawlableLinks, MetaRobots, Hreflang, EmbeddedContent, Canonical, RobotsTxt +27ms
  status Retrieving in-page: Scripts +2s
  status Retrieving in-page: CSSUsage +0ms
  status Retrieving in-page: Viewport +0ms
  status Retrieving in-page: ViewportDimensions +0ms
  status Retrieving in-page: ThemeColor +0ms
  status Retrieving in-page: Manifest +0ms
  status Retrieving in-page: RuntimeExceptions +0ms
  status Retrieving in-page: ChromeConsoleMessages +0ms
  status Retrieving in-page: ImageUsage +0ms
  status Retrieving in-page: Accessibility +0ms
  status Retrieving in-page: LinkElements +0ms
  status Retrieving in-page: AnchorsWithNoRelNoopener +1ms
  status Retrieving in-page: AppCacheManifest +0ms
  status Retrieving in-page: Doctype +0ms
  status Retrieving in-page: DOMStats +0ms
  status Retrieving in-page: JSLibraries +0ms
  status Retrieving in-page: OptimizedImages +0ms
  status Retrieving in-page: PasswordInputsWithPreventedPaste +0ms
  status Retrieving in-page: ResponseCompression +0ms
  status Retrieving in-page: TagsBlockingFirstPaint +0ms
  status Retrieving in-page: MetaDescription +0ms
  status Retrieving in-page: FontSize +0ms
  status Retrieving in-page: CrawlableLinks +0ms
  status Retrieving in-page: MetaRobots +0ms
  status Retrieving in-page: Hreflang +0ms
  status Retrieving in-page: EmbeddedContent +0ms
  status Retrieving in-page: Canonical +0ms
  status Retrieving in-page: RobotsTxt +0ms
  status Retrieving trace +1ms
  status Retrieving devtoolsLog & network records +110ms
  status Retrieving: Scripts +27ms
  status Retrieving: CSSUsage +53ms
  status Retrieving: Viewport +192ms
  status Retrieving: ViewportDimensions +5ms
  status Retrieving: ThemeColor +13ms
  status Retrieving: Manifest +2ms
  status Retrieving: RuntimeExceptions +295ms
  status Retrieving: ChromeConsoleMessages +1ms
  status Retrieving: ImageUsage +2ms
  status Retrieving: Accessibility +22ms
  status Retrieving: LinkElements +526ms
  status Retrieving: AnchorsWithNoRelNoopener +10ms
  status Retrieving: AppCacheManifest +6ms
  status Retrieving: Doctype +20ms
  status Retrieving: DOMStats +4ms
  status Retrieving: JSLibraries +50ms
  status Retrieving: OptimizedImages +25ms
  status Retrieving: PasswordInputsWithPreventedPaste +234ms
  status Retrieving: ResponseCompression +3ms
  status Retrieving: TagsBlockingFirstPaint +7ms
  status Retrieving: MetaDescription +6ms
  status Retrieving: FontSize +7ms
  status Retrieving: CrawlableLinks +245ms
  status Retrieving: MetaRobots +6ms
  status Retrieving: Hreflang +2ms
  status Retrieving: EmbeddedContent +2ms
  status Retrieving: Canonical +3ms
  status Retrieving: RobotsTxt +6ms
  status Resetting state with about:blank +19ms
  status Loading page & waiting for onload ServiceWorker, Offline, StartUrl +24ms
  status Retrieving in-page: ServiceWorker +59ms
  status Retrieving in-page: Offline +0ms
  status Retrieving in-page: StartUrl +1ms
  status Retrieving devtoolsLog & network records +0ms
  status Retrieving: ServiceWorker +2ms
  status Retrieving: Offline +1ms
  status Retrieving: StartUrl +1ms
  status Resetting state with about:blank +5ms
  status Loading page & waiting for onload HTTPRedirect, HTMLWithoutJavaScript +48ms
  status Retrieving in-page: HTTPRedirect +260ms
  status Retrieving in-page: HTMLWithoutJavaScript +0ms
  status Retrieving devtoolsLog & network records +0ms
  status Retrieving: HTTPRedirect +7ms
  status Retrieving: HTMLWithoutJavaScript +12ms
  status Disconnecting from browser... +7ms
  status Analyzing and running audits... +6ms
  status Evaluating: Uses HTTPS +3ms
  status Evaluating: Redirects HTTP traffic to HTTPS +24ms
  status Evaluating: Registers a service worker that controls page and start_url +1ms
  status Evaluating: Current page responds with a 200 when offline +0ms
  status Evaluating: Has a `<meta name="viewport">` tag with `width` or `initial-scale` +1ms
  status Evaluating: Contains some content when JavaScript is not available +1ms
  status Evaluating: First Contentful Paint +6ms
  status Evaluating: First Meaningful Paint +54ms
  status Evaluating: Page load is fast enough on mobile networks +10ms
  status Evaluating: Speed Index +33ms
  status Evaluating: Screenshot Thumbnails +529ms
  status Evaluating: Final Screenshot +287ms
  status Evaluating: Estimated Input Latency +2ms
  status Evaluating: No browser errors logged to the console +16ms
  status Evaluating: Server response times are low (TTFB) +1ms
  status Evaluating: First CPU Idle +1ms
  status Evaluating: Time to Interactive +30ms
  status Evaluating: User Timing marks and measures +0ms
  status Evaluating: Minimize Critical Requests Depth +2ms
  status Evaluating: Avoid multiple page redirects +3ms
  status Evaluating: Web app manifest meets the installability requirements +2ms
  status Evaluating: Configured for a custom splash screen +1ms
  status Evaluating: Sets an address-bar theme color +0ms
  status Evaluating: Content is sized correctly for the viewport +1ms
  status Evaluating: Displays images with correct aspect ratio +0ms
  status Evaluating: Avoids deprecated APIs +1ms
  status Evaluating: Minimizes main-thread work +0ms
  status Evaluating: JavaScript execution time +11ms
  status Evaluating: Preload key requests +3ms
  status Evaluating: Preconnect to required origins +2ms
  status Evaluating: All text remains visible during webfont loads +2ms
  status Evaluating: Network Requests +1ms
  status Evaluating: Metrics +2ms
  status Evaluating: start_url responds with a 200 when offline +1ms
  status Evaluating: Site works cross-browser +1ms
  status Evaluating: Page transitions don't feel like they block on the network +0ms
  status Evaluating: Each page has a URL +0ms
  status Evaluating: `[aria-*]` attributes match their roles +1ms
  status Evaluating: `[role]`s have all required `[aria-*]` attributes +1ms
  status Evaluating: Elements with `[role]` that require specific children `[role]`s, are present +0ms
  status Evaluating: `[role]`s are contained by their required parent element +1ms
  status Evaluating: `[role]` values are valid +1ms
  status Evaluating: `[aria-*]` attributes have valid values +0ms
  status Evaluating: `[aria-*]` attributes are valid and not misspelled +1ms
  status Evaluating: `<audio>` elements contain a `<track>` element with `[kind="captions"]` +1ms
  status Evaluating: Buttons have an accessible name +1ms
  status Evaluating: The page contains a heading, skip link, or landmark region +1ms
  status Evaluating: Background and foreground colors have a sufficient contrast ratio +1ms
  status Evaluating: `<dl>`'s contain only properly-ordered `<dt>` and `<dd>` groups, `<script>` or `<template>` elements. +1ms
  status Evaluating: Definition list items are wrapped in `<dl>` elements +0ms
  status Evaluating: Document has a `<title>` element +1ms
  status Evaluating: `[id]` attributes on the page are unique +1ms
  status Evaluating: `<frame>` or `<iframe>` elements have a title +1ms
  status Evaluating: `<html>` element has a `[lang]` attribute +0ms
  status Evaluating: `<html>` element has a valid value for its `[lang]` attribute +1ms
  status Evaluating: Image elements have `[alt]` attributes +1ms
  status Evaluating: `<input type="image">` elements have `[alt]` text +1ms
  status Evaluating: Form elements have associated labels +0ms
  status Evaluating: Presentational `<table>` elements avoid using `<th>`, `<caption>` or the `[summary]` attribute. +1ms
  status Evaluating: Links have a discernible name +1ms
  status Evaluating: Lists contain only `<li>` elements and script supporting elements (`<script>` and `<template>`). +1ms
  status Evaluating: List items (`<li>`) are contained within `<ul>` or `<ol>` parent elements +1ms
  status Evaluating: The document does not use `<meta http-equiv="refresh">` +0ms
  status Evaluating: `[user-scalable="no"]` is not used in the `<meta name="viewport">` element and the `[maximum-scale]` attribute is not less than 5. +1ms
  status Evaluating: `<object>` elements have `[alt]` text +1ms
  status Evaluating: No element has a `[tabindex]` value greater than 0 +1ms
  status Evaluating: Cells in a `<table>` element that use the `[headers]` attribute only refer to other cells of that same table. +1ms
  status Evaluating: `<th>` elements and elements with `[role="columnheader"/"rowheader"]` have data cells they describe. +0ms
  status Evaluating: `[lang]` attributes have a valid value +1ms
  status Evaluating: `<video>` elements contain a `<track>` element with `[kind="captions"]` +1ms
  status Evaluating: `<video>` elements contain a `<track>` element with `[kind="description"]` +1ms
  status Evaluating: `[accesskey]` values are unique +1ms
  status Evaluating: Custom controls have associated labels +0ms
  status Evaluating: Custom controls have ARIA roles +1ms
  status Evaluating: User focus is not accidentally trapped in a region +0ms
  status Evaluating: Interactive controls are keyboard focusable +0ms
  status Evaluating: Headings don't skip levels +0ms
  status Evaluating: Interactive elements indicate their purpose and state +1ms
  status Evaluating: The page has a logical tab order +0ms
  status Evaluating: The user's focus is directed to new content added to the page +1ms
  status Evaluating: Offscreen content is hidden from assistive technology +0ms
  status Evaluating: HTML5 landmark elements are used to improve navigation +0ms
  status Evaluating: Visual order on the page follows DOM order +0ms
  status Evaluating: Uses efficient cache policy on static assets +1ms
  status Evaluating: Avoids enormous network payloads +3ms
  status Evaluating: Defer offscreen images +1ms
  status Evaluating: Eliminate render-blocking resources +12ms
  status Evaluating: Minify CSS +28ms
  status Evaluating: Minify JavaScript +64ms
  status Evaluating: Defer unused CSS +69ms
  status Evaluating: Serve images in next-gen formats +12ms
  status Evaluating: Efficiently encode images +11ms
  status Evaluating: Enable text compression +6ms
  status Evaluating: Properly size images +6ms
  status Evaluating: Use video formats for animated content +7ms
  status Evaluating: Avoids Application Cache +11ms
  status Evaluating: Page has the HTML doctype +0ms
  status Evaluating: Avoids an excessive DOM size +1ms
  status Evaluating: Links to cross-origin destinations are safe +2ms
  status Evaluating: Avoids requesting the geolocation permission on page load +1ms
  status Evaluating: Avoids `document.write()` +0ms
  status Evaluating: Avoids front-end JavaScript libraries with known security vulnerabilities +0ms
  status Evaluating: Detected JavaScript libraries +9ms
  status Evaluating: Avoids requesting the notification permission on page load +1ms
  status Evaluating: Allows users to paste into password fields +0ms
  status Evaluating: Uses HTTP/2 for its own resources +0ms
  status Evaluating: Uses passive listeners to improve scrolling performance +1ms
  status Evaluating: Document has a meta description +0ms
  status Evaluating: Page has successful HTTP status code +1ms
  status Evaluating: Document uses legible font sizes +5ms
  status Evaluating: Links have descriptive text +1ms
  status Evaluating: Page isn’t blocked from indexing +1ms
  status Evaluating: robots.txt is valid +2ms
  status Evaluating: Document has a valid `hreflang` +1ms
  status Evaluating: Document avoids plugins +1ms
  status Evaluating: Document has a valid `rel=canonical` +0ms
  status Evaluating: Page is mobile friendly +1ms
  status Evaluating: Structured data is valid +0ms
  status Generating results... +0ms
  ChromeLauncher Killing Chrome instance 7098 +59ms
  Printer html output written to /home/chandan/wdzwdz.com_2019-01-20_19-29-35.report.html +46ms
  CLI Protip: Run lighthouse with `--view` to immediately open the HTML report in your browser +1ms
In der vorletzten Zeile können Sie sehen, dass der Pfad zum Auffinden des Berichts gedruckt wurde. Standardmäßig wird ein Bericht im HTML-Format erstellt, den Sie entweder auf Ihrem PC herunterladen oder über einen Webserver bereitstellen können.
Aber was ist, wenn Sie einen Bericht im JSON-Format generieren müssen?
Es ist wie folgt machbar.
lighthouse URL --chrome-flags="--headless" --output json --output-path URL.json
Durch die Verwendung von Lighthouse CLI haben Sie die volle Kontrolle, um es so zu verwenden, wie Sie es möchten. Ich würde dringend empfehlen, sich das anzusehen GitHub-Repository um mehr über die Verwendung von CLI oder programmgesteuert zu erfahren.
Fazit
Google Lighthouse scheint ein vielversprechendes Tool zu sein, um einen Kontinuitätstest durchzuführen, um die Leistung und Benutzerfreundlichkeit der Website zu verbessern. Wenn Sie WordPress verwenden und Ihre Website schneller laden möchten, sehen Sie sich das an Rakete.